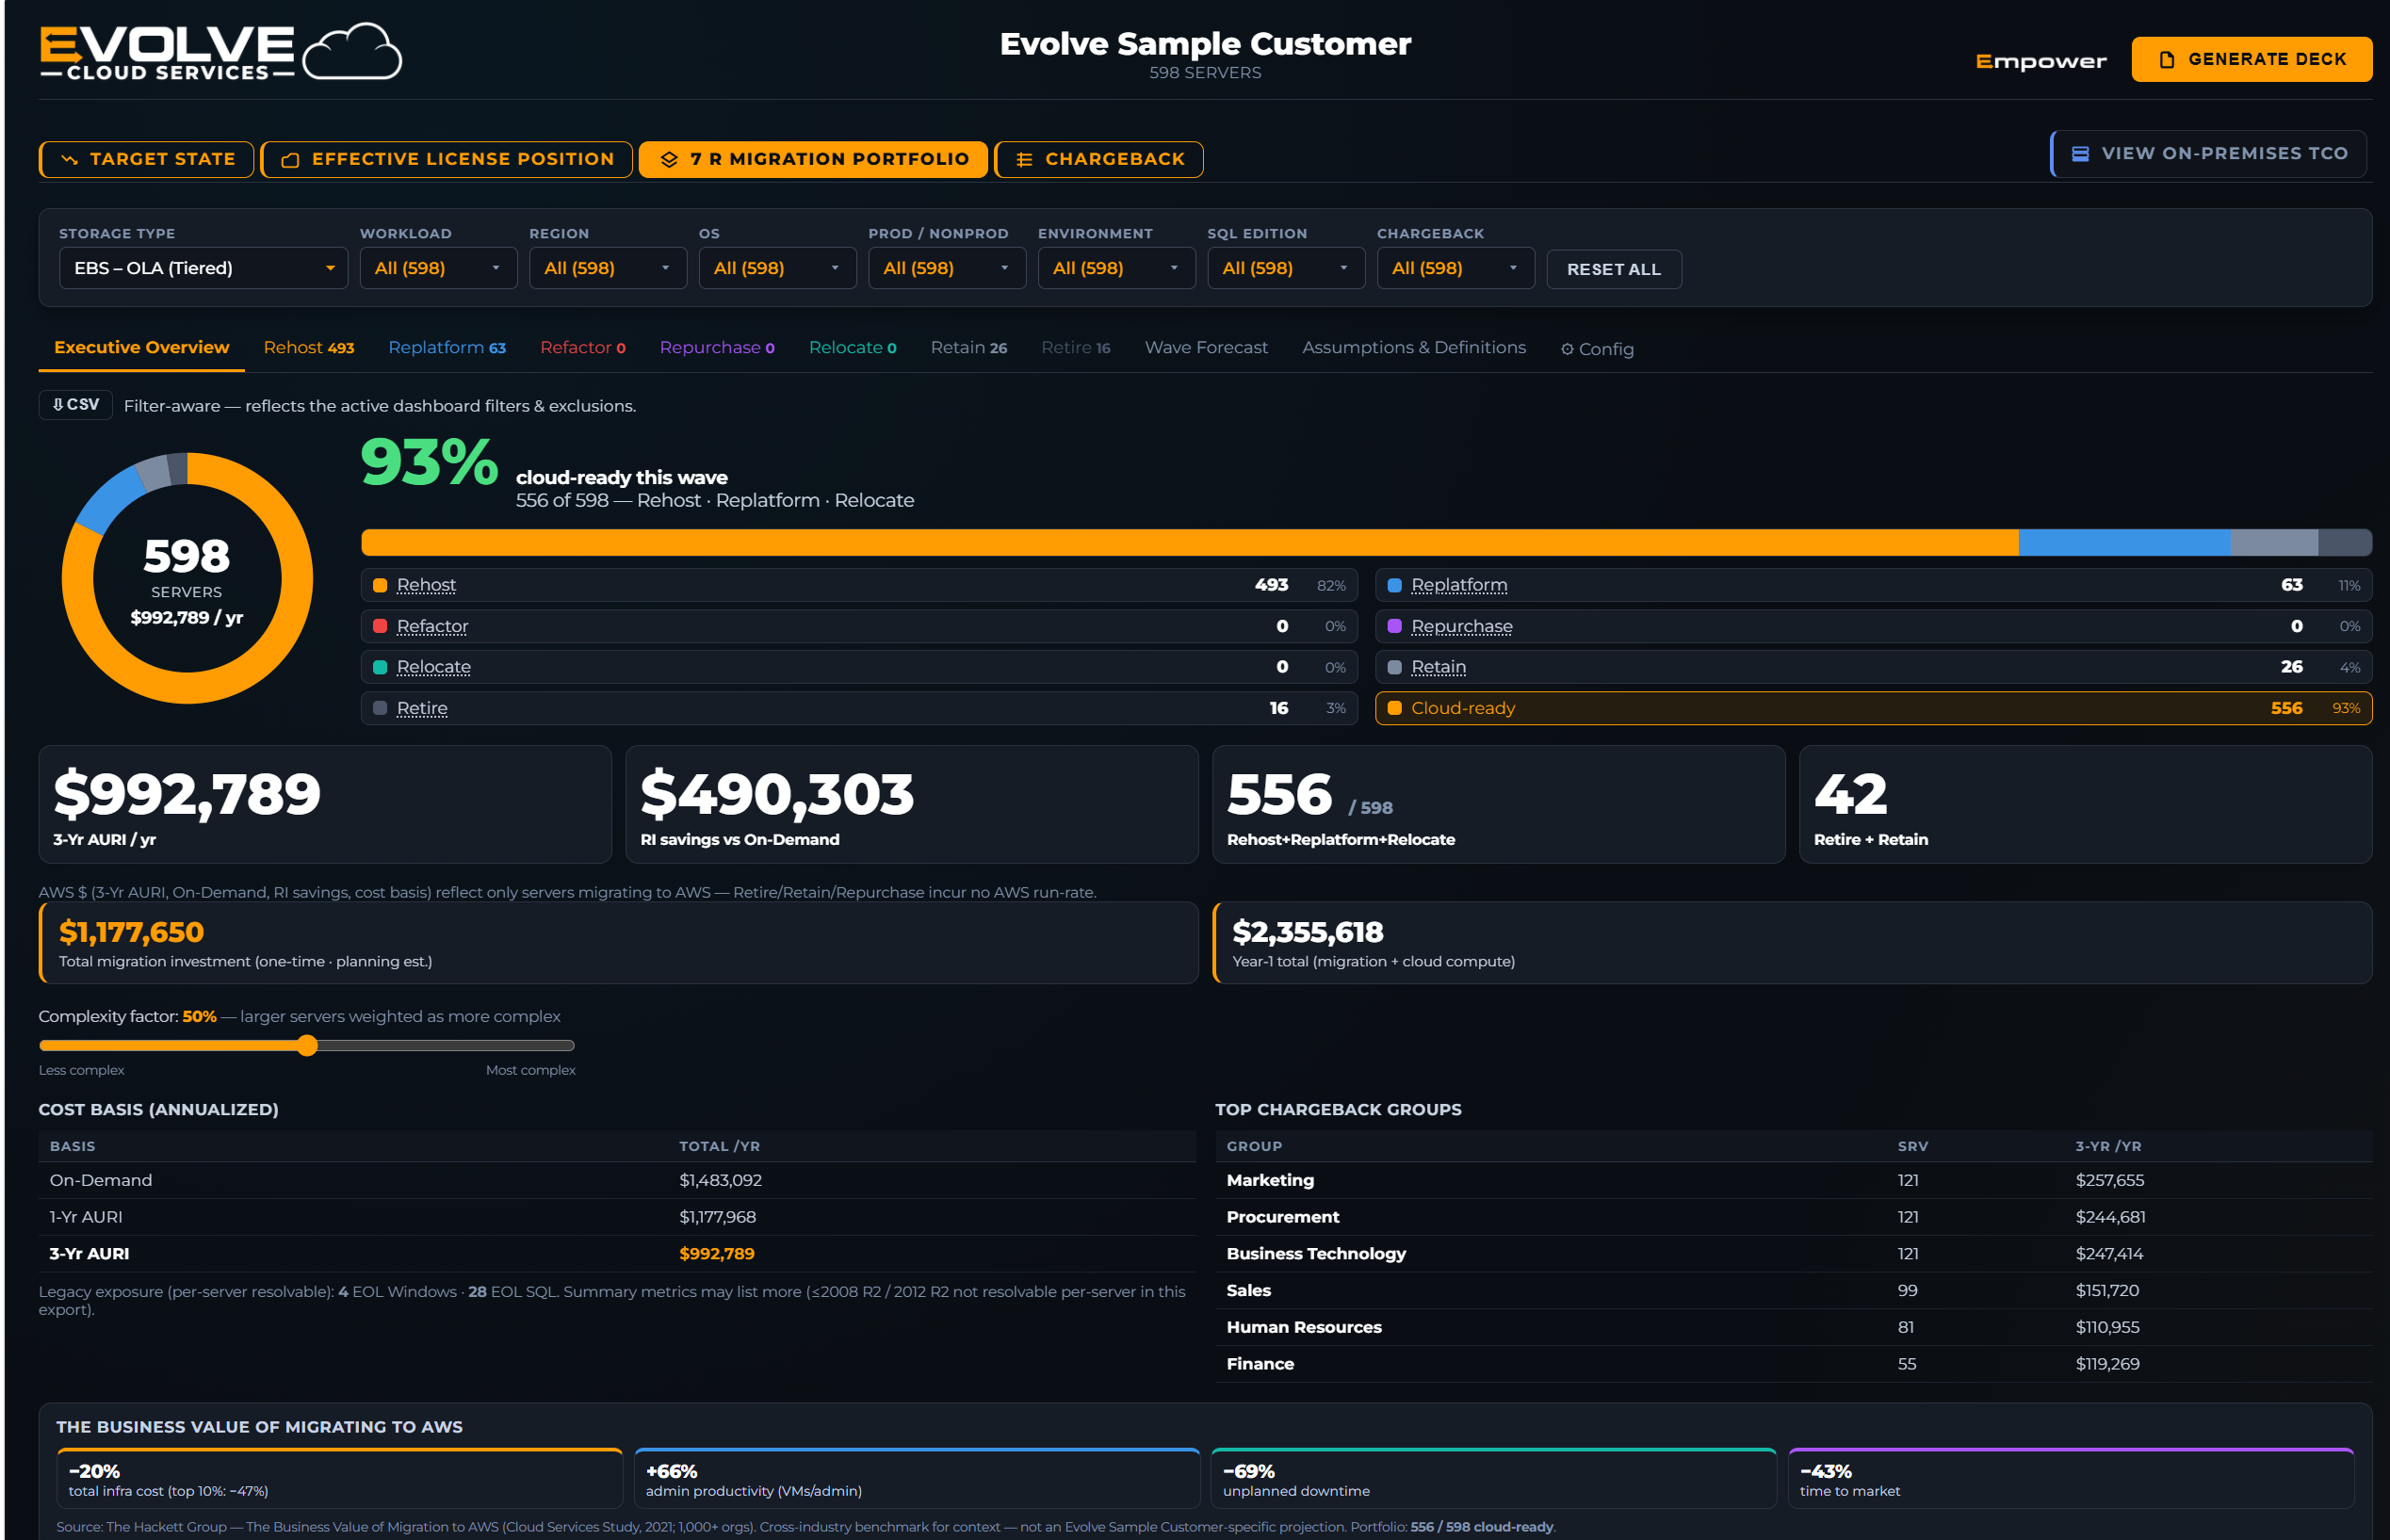
Our proprietary assessment and analytics platform integrates Microsoft licensing analysis directly with infrastructure modeling — one unified view of true cost.
Most assessments answer one question about a single scope. Empower™ answers any question about any scope. Narrow the scope by workload, region, operating system, environment, SQL edition, chargeback owner or exclude individual servers outright. The entire model recalculates instantly: compute, storage, licensing position, and total cost of ownership. There is no second export, no re-run, and no waiting on an analyst. The question a stakeholder asks in the meeting gets answered in the meeting.
Models included: EC2, RDS, NC2, EVS, EBS/FSxN Storage, EUC, VMware Renewal
Seven filter dimensions, freely combinable, plus per-server include and exclude
Every KPI, chart, table, and comparison recalculates against the scope you define
The active scope is stamped onto the dashboard view and matching PowerPoint, so a number is never separated from the scope it describes
software licensing costs vs. all other cloud infrastructure combined
average reduction in Windows Server cores requiring licensing
of assessments result in fully license-compliant BYOL environments
additional compute optimization identified beyond standard rightsizing tools
A BYOL decision is never one decision. Empower™ separates what you already own from a potential licensing shortage and lets you treat each scenario independently — renew existing agreements as they stand, apply Enterprise downgrade rights you have already paid for, move to subscription, convert to Annual Software Assurance, or shift onto AWS License-Included. Then cover whatever potential shortage that remains however you choose to cover it.
Every combination reprices immediately against current Microsoft licensing rules, across the whole estate or the filtered slice of it. And every one of them is a scenario, not an edit: the levers explore possibilities without ever altering the source assessment data underneath.
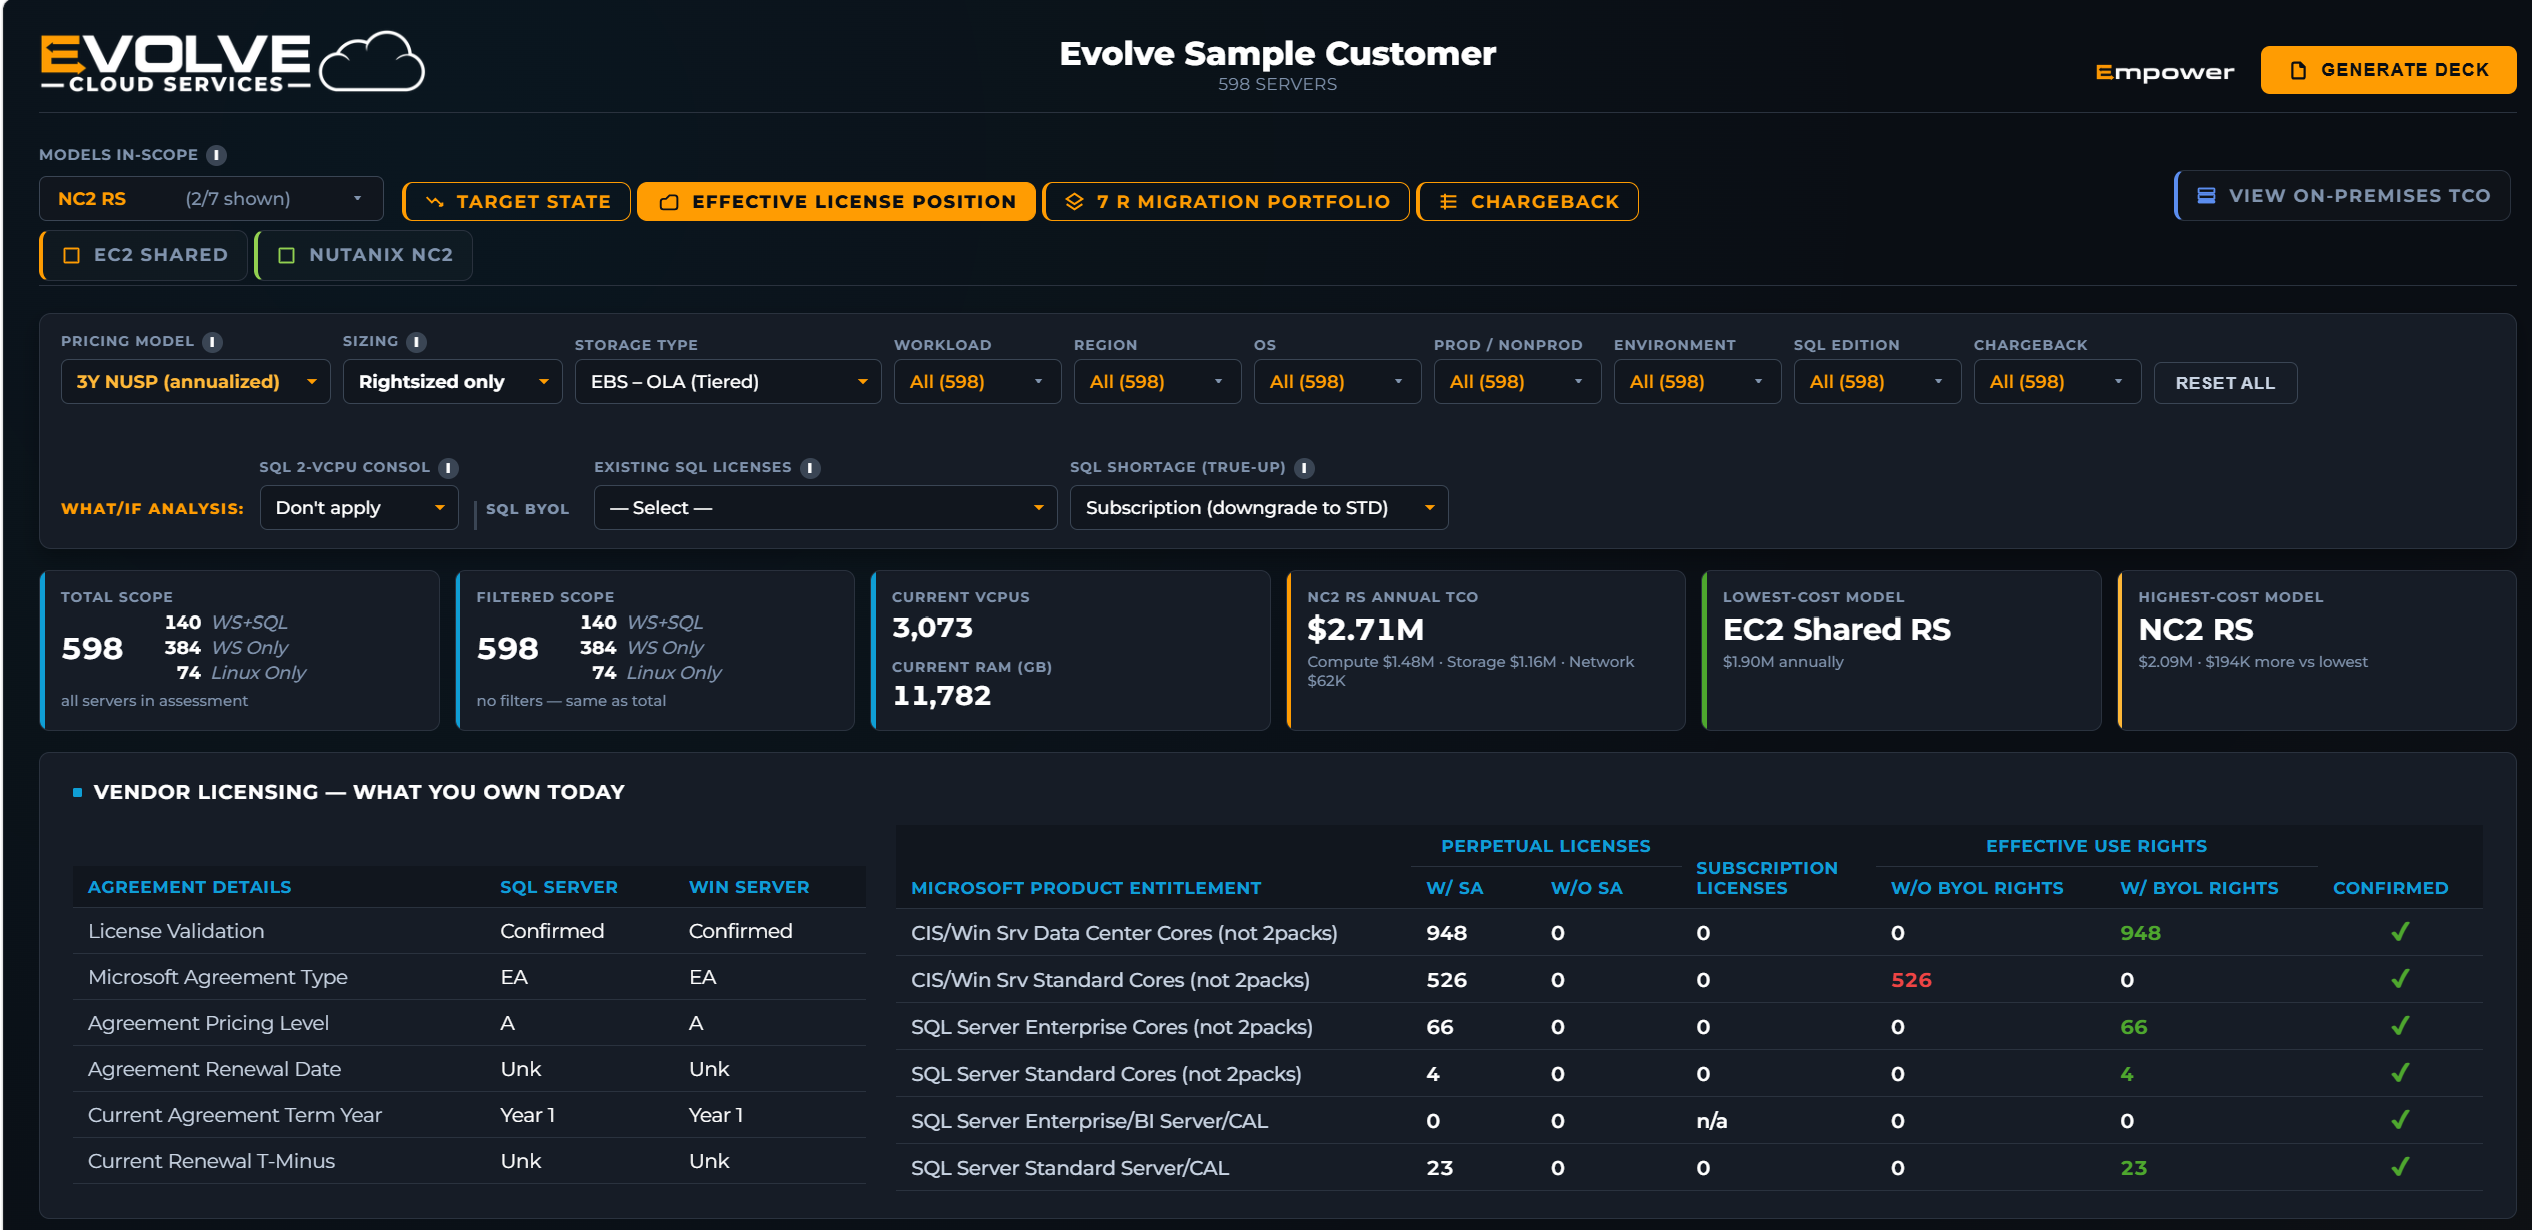
The generated PowerPoint presentation is not a static file produced once, at the end, from one set of assumptions. Whatever is on screen — the scope you filtered to, the licensing levers you set, the pricing model you chose, the deployment models you kept in scope — Empower™ generates a complete PowerPoint from that exact state, in seconds.
Because the deck and the dashboard are produced by the same calculation engine, the numbers cannot disagree. A stakeholder who asks “can I see that filtered to production only?” gets a dashboard answer and a deck to take away from the same question.
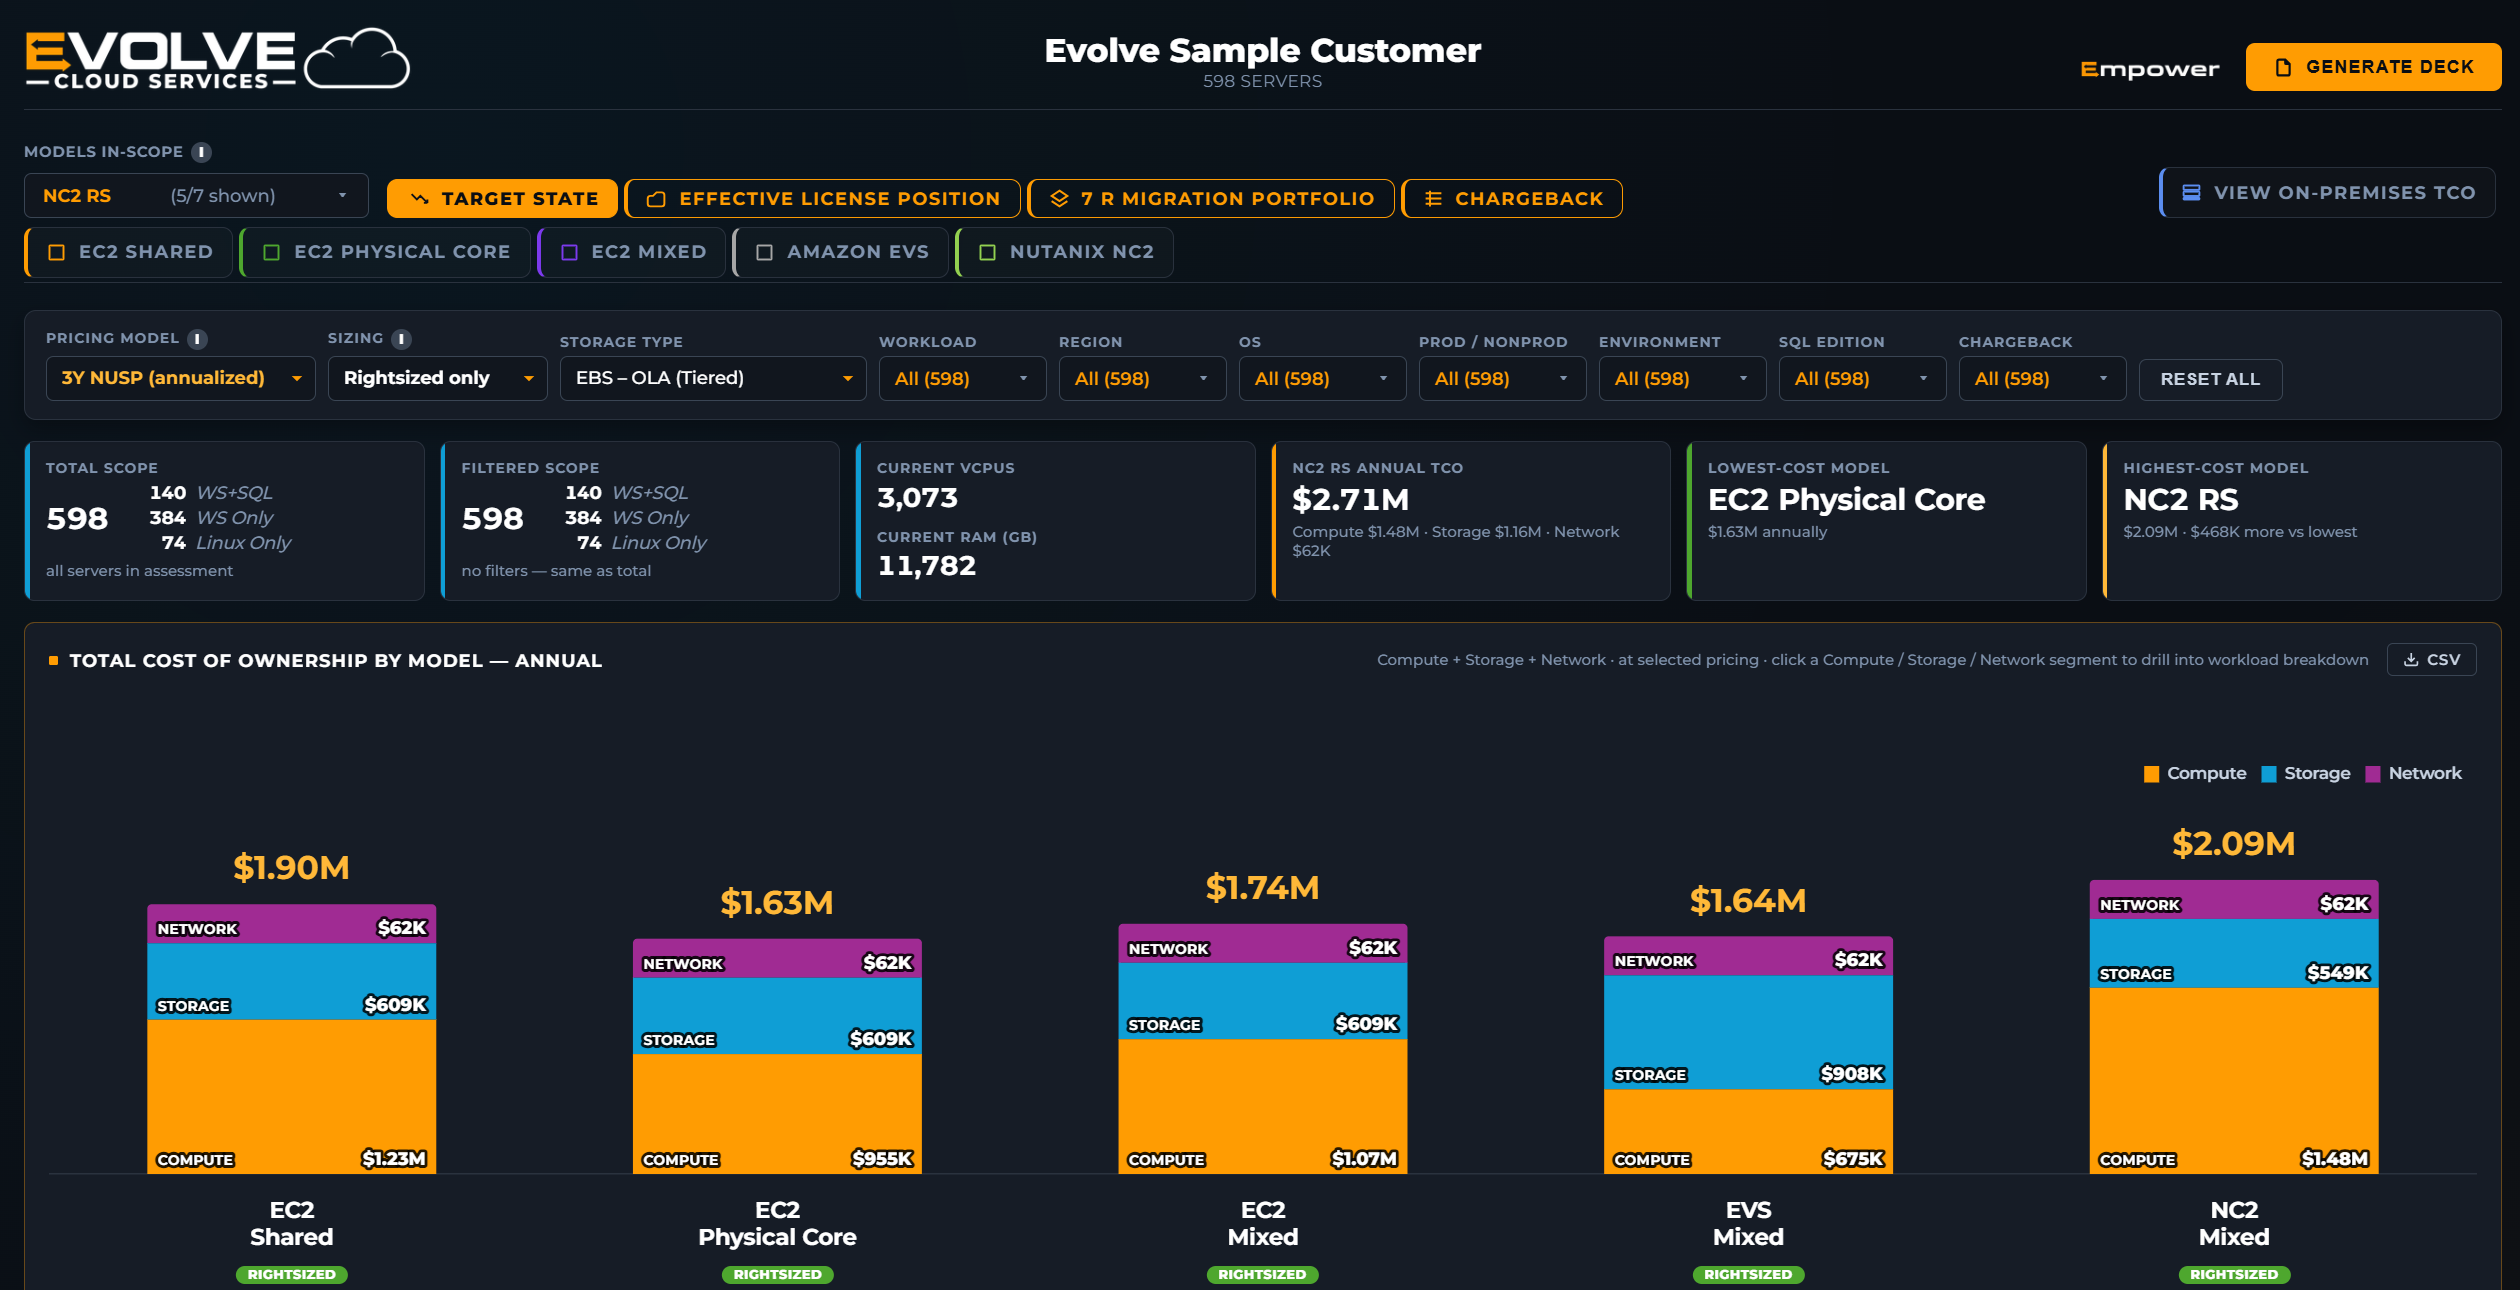
Knowing that a migration saves money is not the same as knowing which target to migrate to. Empower™ models all seven deployment options in a single pass, then puts them side by side: same scope, same pricing model, same licensing reconciliation process, so the difference you are looking at is the architecture and nothing else.
And when someone inquires about a figure — they always do — you drill. Every headline number opens into the models, the workloads, and finally the individual servers that produced it.
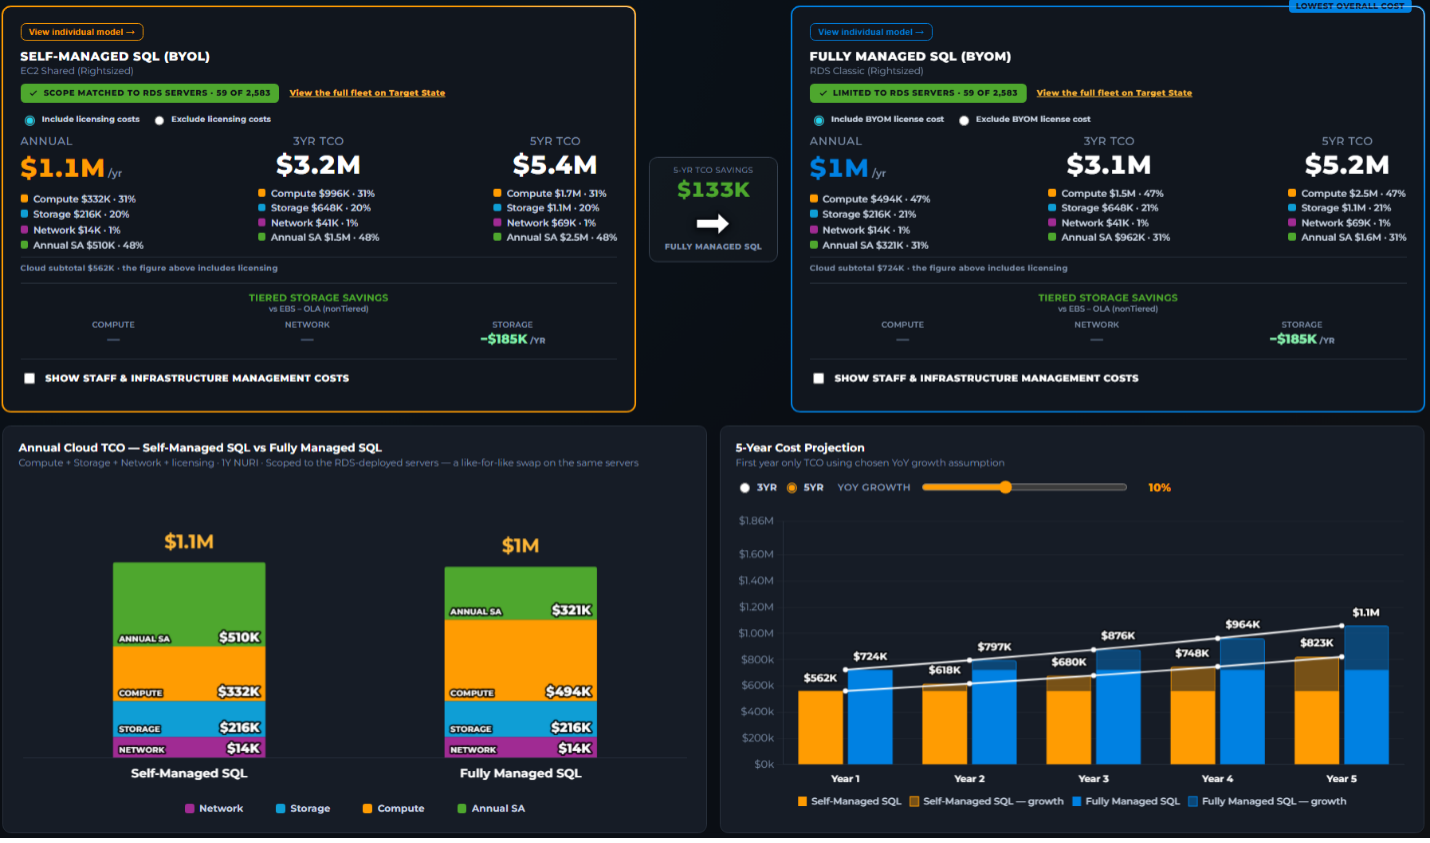
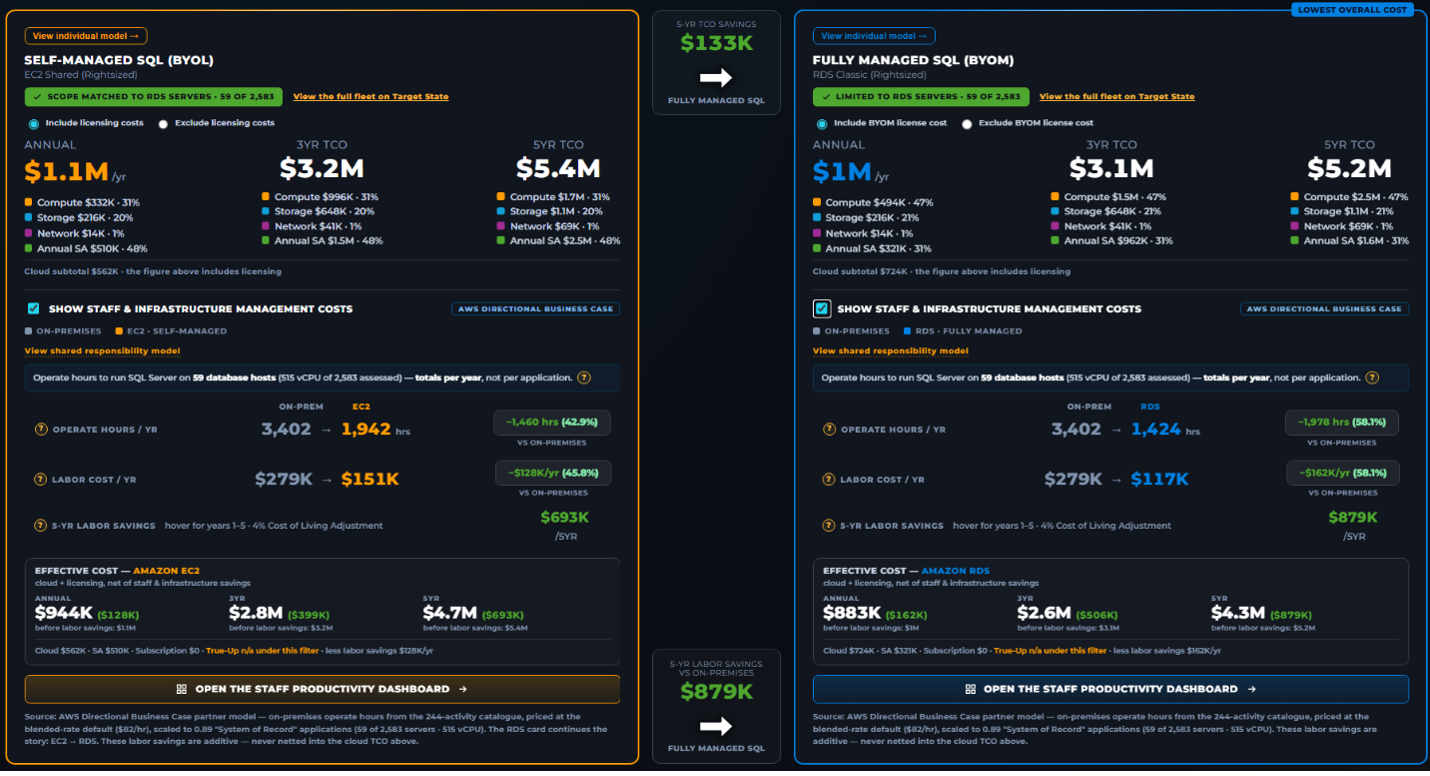
Every infrastructure comparison prices compute, storage, network, and licensing — and then quietly assumes the operational effort is identical on both sides of the decision. It isn’t. Running SQL Server yourself and running it on a fully managed database service are different jobs, and the difference shows up in operate hours: patching, backup and recovery, high-availability configuration, capacity work, upgrade cycles.
Empower adds that as a line item alongside the infrastructure costs. Built on AWS’s published rule set for staff and infrastructure management costs, it models the operate hours behind each deployment option — separately for database administration, systems administration, engineering, storage, development, and infrastructure — then prices them at a blended labor rate you set yourself.
It also models the whole progression rather than just the endpoint: on-premises, self-managed on EC2, and fully managed on RDS. That separates two questions executives are usually handed one blended answer to — what does moving to the cloud save, and what does moving to managed save on top of it.
An assessment that stops at a number stops too early. Empower™ provides the tagging methodology to classify every workload against the 8 Rs, builds a wave-based migration roadmap with forecast timing and effort, and allocates cost back to the business units that own it — with an editor for the inevitable cases where the org chart and the CMDB disagree.
Chargeback owner is itself a filter dimension, so a business unit’s leadership can be shown their estate, their cost, and their migration wave forecast, without ever seeing anyone else’s.